Prerequisites
Before proceeding with this guide, it’s recommended that you follow Getting Started guide to become familiar with ThingsBoard devices and dashboards. This will enhance your learning experience and understanding of the concepts presented here.
Introduction
ThingsBoard offers a powerful feature – the ability to create and customize interactive visualizations, also known as dashboards. These dashboards are instruments for monitoring and managing your data and devices efficiently. With ThingsBoard dashboards, users can adapt interfaces to their specific needs, making it easier than ever to inspect their IoT devices and data. What’s brilliant is that each dashboard can be populated with numerous widgets, offering flexibility and customization. These dashboards aren’t limited to a single data source; they can display data from various entities, including devices, assets, and more. Plus, you can assign dashboards to specific Customers, ensuring that the right individuals or teams have access to the data they need.

Dashboards in ThingsBoard provide users with the following capabilities:
- Data Visualization: Users can create various widgets such as charts, graphs, tables, and more to visualize data obtained from connected devices. This enables operators and analysts to easily analyze information and track device statuses.
- Device Management: Dashboards can be used to perform management operations on devices, such as turning devices on or off, changing parameters, and so on. Users can set actions and respond to real-time data from devices.
- Interactivity: Dashboards can be designed with interactive elements such as buttons, switches, allowing users to interact with devices and data.
- Display Customization: Users can customize the arrangement and size of widgets, choose color palettes, fonts, and other visualization aspects to create a user-friendly and informative interface.
- Role-Based Access: ThingsBoard allows controlling access to dashboards with different levels of privileges based on user roles. This ensures data security and confidentiality.
ThingsBoard also offers convenient IoT solution templates to reduce time-to-market for your IoT products. These templates include interactive dashboards, processing logic, sample devices, users, and all other necessary entities. Think of these templates as a complete PoC/MVP. Read more about solution templates here.
This guide covers main concepts and various dashboard settings.
Create new dashboard
To add a new dashboard, you should:
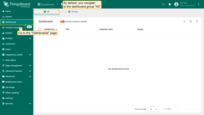
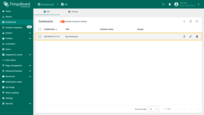
- Login to your ThingsBoard instance and navigate to the “Dashboards” page through the main menu on the left of the screen. By default, you navigate to the dashboard group “All”;
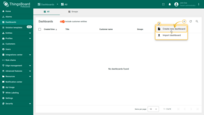
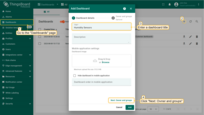
- Click the “+” sign in the upper right corner of the screen, and select “Create new dashboard” from the drop-down menu;
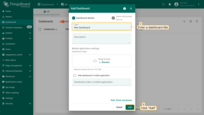
- In the opened dialog, it is necessary to enter a dashboard title, description is optional. Click “Add”;
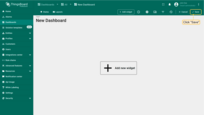
- Once you have created the dashboard, it will be automatically opened. Save it by clicking the “Save” button in the upper right corner.
- Your first dashboard has been successfully created. As you continue to add new dashboards, they will appear at the top of the list. This default sort is based on the creation timestamp.
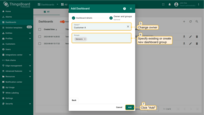
At the stage of creating a dashboard, you can specify it to a different owner and a specific dashboard group right away. How to create a new group of dashboards, read here.
- In the “Add Dashboard” dialog, enter the dashboard title, and then click “Next: Owner and groups”;
- Change the owner and select an existing dashboard group or create a new one, then click “Add”;
- The created dashboard is located in the “Sensors” dashboard’s group and belongs to Customer A.
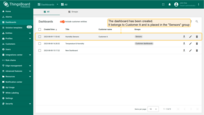
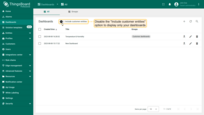
By default, the list of dashboards displays all dashboards, including those of your customers. To view only your dashboards, disable the “Include customer entities” option.
Dashboard toolbar
Before starting working with a dashboard, get familiar with its interface to understand which features are responsible for what actions.
The dashboard toolbar allows you to manage states, layouts, settings, aliases, filters, version control, configure time window, enter edit mode and add new widgets using the corresponding icons in the toolbar.
Some of these icons (states, layout, settings, entity aliases, filters, version control, add new widget) are visible only in the “Edit” mode. All other icons are visible in both “View” and “Edit” modes. You can hide these icons or configure the toolbar to be minimized by default using settings.


Edit mode
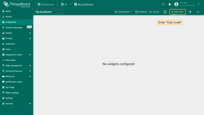
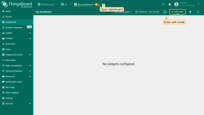
To enter dashboard edit mode, simply open the dashboard you wish to edit and click the “Edit mode” button found in the upper right corner of the screen.
Once you’ve switched to edit mode, you access the dashboard toolbar to add new elements and access controls. Don’t forget to save your changes using the “Save” button, or if you decide to discard any unsaved edits, you can do so by clicking the “Cancel” button.
Add new widget
All IoT dashboards are constructed using ThingsBoard widgets. A widget is an element that displays a specific type of information or functionality on a dashboard. Widgets are used to visualize data, remote device control, alarms management, and display static custom HTML content.
To add a widget to a dashboard, you should:
- Open your dashboard and enter edit mode;
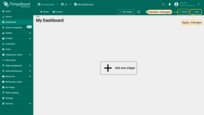
- Click the “+ Add widget” icon at the top of the screen, or (if this is your first widget on this dashboard) click a large “Add new widget” sign in the middle of the screen to open the Select widgets bundle dialog box;
- Select a widget bundle, such as “Charts”. To quickly find your desired widget, use the search bar by clicking the magnifying glass icon and entering the widget’s name;
- Choose a widget, for instance, “Timeseries Line Chart,” and click on it to open the “Add Widget” dialog window;
- Specify the data source, add the data key, and click the “Add” button. Finally, apply your changes;
- Your first widget has been created.
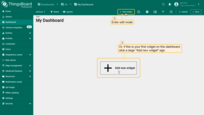
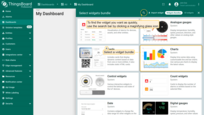
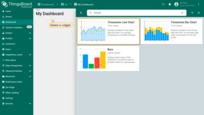
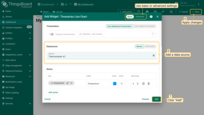
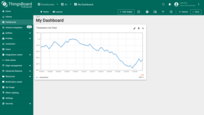
Each widget typically has specific settings and parameters that allow users to customize its behavior and appearance according to their needs. For more information about widgets, how to create them, and their settings, click the button below:
Time window
The Time window is a tool used to define time intervals when working with telemetry data. The time window is used by all time series and alarm widgets unless they are configured to use their own widget time window. In the case of a time series widget, ThingsBoard fetches telemetry with a timestamp that matches the time window. In the case of an alarm widget, ThingsBoard fetches alarms with the created time that matches the time window.
The time window can work in two modes:
- In the real-time mode, widgets constantly receive updates from the server and automatically show you only the data that matches the time window for a current timestamp;
- In the history mode, widgets receive data only during the initial load and no updates are issued over WebSockets.
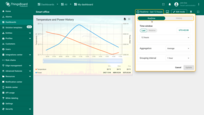
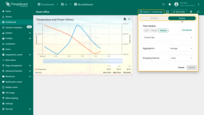
Key parameters of the time window:
- Last: Displays real-time data for a specified time interval (e.g., the last 5 minutes, the last hour, or the last 24 hours).
- Range: Displays data for a fixed period, such as from December 1, 2024, to December 7, 2024.
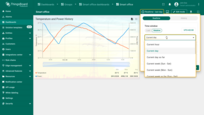
- Relative: Uses predefined intervals, such as the current day, the previous day, or the previous month.

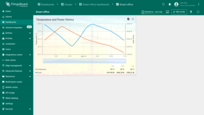
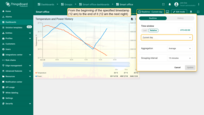
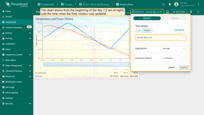
To display data for your desired time period, set the time range in the time window and click “Update”.
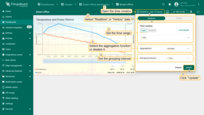

Please note:
that the Current day interval means 24 hours (12 am at night to 12 am the next night), whereas the Current day so far means from 12 am at night until the time when the time window was updated. All other intervals are distinguished in the same way.
Aggregation
The data aggregation function is applied to time series data and does not apply to alarms. Currently, six aggregation functions are available:
- Min: Identifies the smallest value among all data in the selected time interval. Useful for displaying the minimum value, such as the lowest temperature recorded in an hour.
- Max: Identifies the largest value among all data in the selected time interval. This is useful for displaying the maximum value, such as the highest energy consumption level.
- Average: Calculates the arithmetic mean of all data in the selected interval. Useful for analyzing average metrics, such as the average humidity over a day.
- Sum: Computes the total sum of all values in the selected time interval. This can be helpful for calculating the total volume of water or electricity consumed.
- Count: Counts the number of records in the selected interval. Useful for assessing the volume of data received or to count the number of events.
- None: Transmits raw data without applying any aggregation functions. Used when access to each unaltered value is required.
Data aggregation is useful when you do not want to retrieve all raw time series data to the user interface but prefer to pre-aggregate it at the database level.
Using aggregation functions helps save network bandwidth and reduces the computational load on the client’s browser. We recommend using aggregation functions whenever possible, especially when dealing with a large amount of raw data points.
